The 16th of July 2020 was “Get to Know your Customers Day”. We as a tech company therefore decided to explore a key concept when it comes to keeping your customers happy as they interact with your brand – user experience (UX). The big question is – how do you know that you are on the right track in your UX efforts?
In this article, we explore how you can measure UX. Let’s dive right in.
So, what is UX?
While user experience can easily pass as the experience that a user has when using or interacting with a product, there is more to it.
A more wholesome UX definition would be:
“The singular and accumulated experiences that users have as a result of interacting with an object or product within a context.”
Why is UX important for your brand?
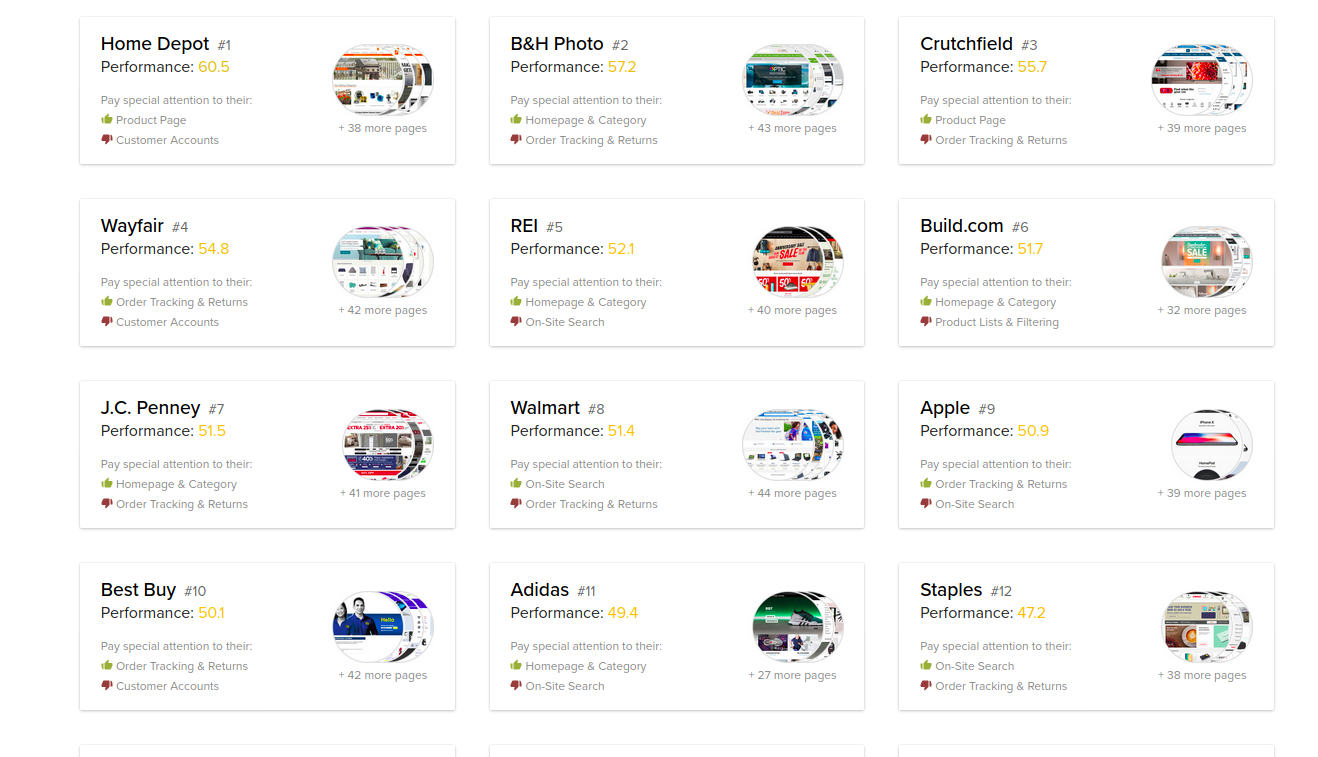
The above screenshot is from Baymard Institute’s UX benchmark of 60 top e-commerce sites ranked by user experience performance. This company has been studying UX, specifically, checkout UX for over a decade. Here are some mind-boggling stats:
- the checkout’s design and flow, is solely the main reason users abandon carts, most of the time
- an average site needs to make at least 39 unique improvements to their checkout flow
- the global average cart abandonment rate is 69.2%
The above stats point to the reasons why every brand needs to prioritize its UX. Let’s briefly look at a few below:
UX affects your revenue…big time
We have just seen that 69.2% of customers will abandon their shopping carts at some point in the checkout flow. This is a lot of revenue for e-commerce sites.
UX has a toll on brand perception
One of the companies that has had to work so hard on it’s brand perception is Uber. In addition to making a public promise to prioritize listening to customers, cities, communities and employees, the brand went ahead to do a complete UX overhaul that was in line with one of the brand’s core values – to always do the right thing.
The company actually re-designed their driver app with input from its drivers, and better still, had their CEO test it out first. Talk about a redemption of the brand from the users’ perspective.
UX helps to design seamless customer journeys
According to the Adobe Experience Index 2020 Digital Trends, customer journey management is one of the top priorities for organizations and companies in 2020.
When you map out your customer’s journey, it gives you an idea of their experience with your brand or product, and their expectations. You are able to see what you are doing great, and where you are simply not meeting their expectations.
How do you measure UX?
There are two approaches to measuring UX: using the ROI or using KPIs.
ROI vs KPIs
The difference between these is that the former is a purely financial perspective. An example would be: you invest $10,000 in UX and get a $200,000 increase in revenue.
On the other hand, KPIs are more specific to the goals (not necessarily financial) that you set for your users. An example would be that you want the users to successfully complete their profiles. While this may not be directly related to ROI, it does affect it as complete profiles will help you with user insights that you can further analyze to make your UX better.
Our focus here will be on the KPIs.
UX KPIs
Task success rate (TSR)
If you need the user to complete some tasks on your app or site, then you need to make it easy for them to do so.
TSR is a percentage of the number of users who successfully complete a task. If 20 users were set to complete a task like completing a profile, but only 15 successfully complete it, then, your TSR will be:
(15/20)* 100% = 75%
Of importance is the fact that you can progressively measure TSR. You can begin to measure it when a customer is new to your product and progressively measure it as they become more familiar with it.
Time on task
Closely related to TSR is time on task. This is the time that users spend on a particular task. In our profile completion example, the shorter the amount of time it takes a user to complete their profile, the better the UX.
If out of 20 customers, 15 take 5 minutes to complete their profiles, then you are definitely doing something wrong.
User error rate
This is a measure of the number of times a user gets something wrong. If you require users to enter their credit card information, for example, and they keep entering their account number instead of the card number, then that is bad UX.
Measuring user error rate
There are two ways to measure user error rate:
- Calculating the error rate
To calculate error rate, we sum up the total number of errors made by all the users, then divide them by the number of users to give us the average number of errors each user made. We then divide the result by the number of possible errors (5 in this case)
If we had 10 users make 15 errors, our error rate would be:
((15/10)/5)*100% = 30%
- Calculating the error occurrence rate
Here, we divide the total number of errors for all users by the total number of possible errors for all users (number of possible errors per user = 5)
If we had 10 users out of 20, make 15 errors, our error occurrence rate would be:
15/(5*20)*100% = 15%
In conclusion
You now need not worry about how to measure your UX. You can set very clear goals that can tie into your bigger financial or business goals. Remember, at the core of UX is getting to know your customer.
Looking for a software company that places UX at the centre of its solutions? Look no further. Contact us today.